 Preferences, as we understand them, don't have anything to do
with what is feasible and therefore, with where the PPF lies. They do, however,
play an important role in determining which combination of goods
is actually produced. Thus, 5 is the appropriate graph as it shows a change in the bundle being
produced. Specifically, it shows a change to fewer houses and more
wheat than before.
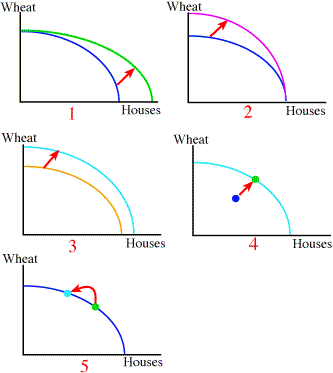
Preferences, as we understand them, don't have anything to do
with what is feasible and therefore, with where the PPF lies. They do, however,
play an important role in determining which combination of goods
is actually produced. Thus, 5 is the appropriate graph as it shows a change in the bundle being
produced. Specifically, it shows a change to fewer houses and more
wheat than before.