Multiple Choice Questions for Introduction

Make your browser window as large as possible

  1. Suppose you turn down a job with a brokerage firm at $40,000 per year to start your own business. At the end of the first year, after paying all your expenses, your personal income comes to $60,000. For the first year, you:
    1. earned economic profits of $60,000.
    2. earned economic profits of $20,000.
    3. earned economic profits of $100,000.
    4. incurred economic losses of $20,000.
    5. there is not enough information to determine economic profit or loss.
    Answer for the Question Above


  2. Suppose everything is the same as in the previous question except that you also invested $100,000 of your own money in the business. Suppose that typical investments in this economy earn 10%. At the end of the first year, after paying all your expenses, your personal income comes to $60,000. For the first year, you:
    1. earned economic profits of $40,000.
    2. earned economic profits of $50,000.
    3. incurred economic losses of $80,000.
    4. earned economic profits of $10,000.
    5. earned economic profits of $6,000.
    Answer for the Question Above


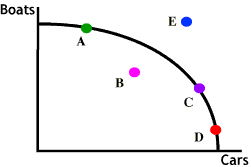
    Figure 1
  3. Consider the Production Possibilities Frontier shown above in Figure 1. Which point(s) shown is/are not feasible?
    1. A,B,C.
    2. A,C,D.
    3. B,D.
    4. E.
    5. B.
    Answer for the Question Above


  4. Which feasible combinations of cars and boats would be preferred to B in Figure 1?
    1. A and C.
    2. C and D.
    3. any points which lie on the PPF as B are inefficient.
    4. none are necessarily preferred to point B.
    5. A, C and D.
    Answer for the Question Above


  5. Of the points shown above in Figure 1, the opportunity cost of boats in terms of cars is lowest at point:
    1. A.
    2. B.
    3. C.
    4. D.
    5. E.
    Answer for the Question Above
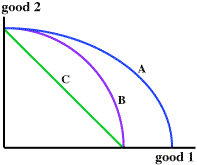
    Figure 2
  6. Consider the movement from Production Possibilities Curve B to A in Figure 2, this could be brought about by:
    1. an increase in unemployment.
    2. an increase in employment.
    3. a change in preferences between goods 1 and 2.
    4. an improvement in the technology used in producing good 1.
    5. an improvement in the technology used in producing both goods.
    Answer for the Question Above


  7. One difference between Production Possibilities Curves B and C in Figure 2 is that:
    1. the opportunity cost of good 1 in terms of good 2 is constant on curve B, but is different at different points on curve C.
    2. the opportunity cost of good 1 in terms of good 2 is constant on C, but is different at different points on B.
    3. curve B implies that good 1 is always preferred to good 2.
    4. if all resources are used to produce good 2, then B implies more can be produced than on C.
    5. curve B implies more efficient production of both goods than C.
    Answer for the Question Above
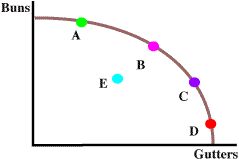
    Figure 3


  8. Consider the PPF shown above. Compared to point E in Figure 3, which of the points above can we say for sure would be preferred by any society that values both buns and gutters?
    1. A and B.
    2. B.
    3. B and C.
    4. C and D.
    5. all the points on the PPF since they are "efficient" and E is not.
    Answer for the Question Above
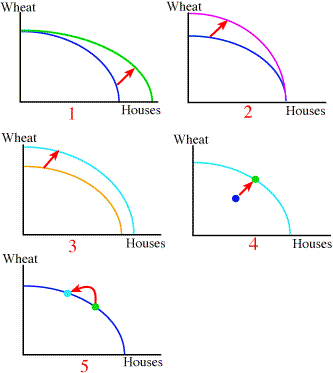
    Figure 4
  9. Suppose a change in technology is developed that allows more wheat to be grown per acre, we would depict this change by which of the graphs in Figure 4?
    1. 1.
    2. 2.
    3. 3.
    4. 4.
    5. 5.
    Answer for the Question Above


  10. Which of the above graphs in Figure 4 is consistent with a reduction in unemployment?
    1. 1.
    2. 2.
    3. 3.
    4. 4.
    5. 5.
    Answer for the Question Above


  11. Which of the graphs in Figure 4 is consistent with a change in society's preferences?
    1. 1.
    2. 2.
    3. 3.
    4. 4.
    5. 5.
    Answer for the Question Above
    © 1995-2004 OnLineTexts.com - All Rights Reserved