
Copyright © 1995-2004 OnLineTexts.com, Inc. - All Rights Reserved
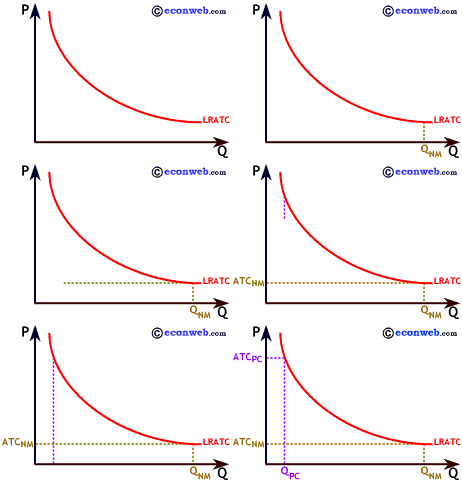
 Graphically, a natural monopoly will have a Long Run Average Total Cost Curve like the one shown to the right, labeled LRATC. The resulting returns to scale insure that larger firms have lower per unit production costs.
Suppose the quantity QNM is to be produced by a single firm. On the graph to the right we see that the average total cost per unit is ATCNM. However, if we insisted on producing the same output in 10 small firms, each firm might produce QPC and the average total cost per unit would be ATCPC. In such an industry the cost of competition may be so high it is better to allow a single firm to operate as a monopoly, and then regulate it so that it does not charge monopoly prices.


Copyright © 1995-2004 OnLineTexts.com, Inc. - All Rights Reserved