
The following explanation utilizes changing oil prices and resulting behavioral changes over the last quarter of a century in the U.S., illustrating the difference between short and long run elasticity and the overwhelming importance of relative prices in driving consumption behavior.
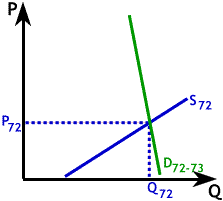
Per capita energy consumption in the U.S. consistently surpasses that of other countries. Usage per person reached a high point in 1972 as a result of years of cheap, plentiful petroleum supplies. Automobiles built for the U.S. market were, on the whole, large, heavy and powerful, resulting in fuel inefficiency. Many homes used oil for heating and were poorly insulated. The use of air conditioning grew rapidly in homes and businesses. Families continued to move to suburban areas which required long commutes to work. Middle-class families found it practical to own more autos per family, often one for each driver. In short, energy conservation wasn't a primary concern in most U.S. households. The graph to the right illustrates the market for oil and petroleum products in 1972 and early 1973. Per capita consumption of petroleum products was high and demand, D72-73, was very inelastic.
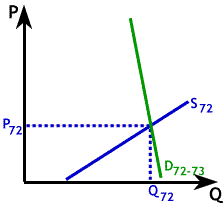
In 1973, Arab oil-producing countries stopped shipping oil to the U.S. This action created an immediate reduction, or shift back, in supply, shown to the left as a shift from S72 to S73. Inelastic demand for petroleum products caused oil and gasoline prices to rise quickly, roughly quadrupling in a short period of time. The price of heating oil, electricity and other energy sources rose as well. Part of the reason for the rapid run-up in price was the inelasticity of demand for energy. Demand for energy was inelastic because, in the short run, it was difficult to alter choices made during periods in which energy was cheap. Improving insulation in existing homes is costly, as is moving to shorten commutes to work. Even if consumers wanted to purchase fuel-efficient automobiles, U.S. auto manufacturers weren't producing many fuel-efficient models. The legendary Detroit "Muscle cars" (cars with large V-8 engines usually rated at 400 horsepower and above, and geared low for rapid acceleration and therefore very poor gas mileage) and large luxury cars (also with large V-8 engines) had been popular in the late 60s and early 70s. Even typical family sedans and station wagons were huge by 1990 standards. Methods which could be adopted fairly quickly, such as car pooling and resetting thermostats, took time to show a significant impact on overall energy consumption.
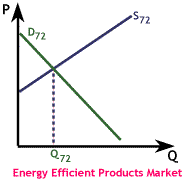
To the right is a graph of the market for energy efficient products, not to be confused with the other graphs on this page which are graphs of the demand for energy. Higher prices for energy led to an increase in demand for more energy efficient products such as smaller, lower-powered cars, better insulation products for new and older homes, and more efficient heating and cooling systems for homes and businesses. This increase in demand for energy efficient products is shown as the shift from D72 to D82. We can think of gasoline as an important complementary good for energy inefficient products thus reducing demand for these products and increasing the demand for substitute products, specifically energy efficient products. As demand for energy efficient products rose over time, firms found it profitable to switch their productive resources into production of these products, causing the supply curve for energy efficient products to shift out as well from S72 to S82. Over the next decade consumption of energy efficient products rose, driven almost entirely by higher energy prices.
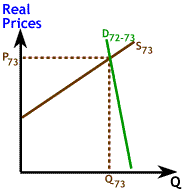
Note that the vertical axis to the left is labeled Real Prices. When comparing demand over a period of years or decades, it is important to remember that the purchasing power of a dollar changes significantly over time. When we refer to Real Prices, we mean prices that have been adjusted to try and capture this difference, allowing us to meaningfully compare demand over longer time periods.
As more energy efficient products replaced older, less efficient models, public transportation improved and car pooling became more common. Consumers adjusted to cooler indoor temperatures in winter and warmer temperatures in summer. Residence choices by families often resulted in attempts to find suitable housing closer to schools and jobs to reduce commuting costs. These and other changes reduced per capita demand for energy well below what it had been in the early 70s, shown in the shift from D72-73 to D80s. During this same period oil supplies increased somewhat to S80s, so both lower prices and reduced consumption relative to 1973 were evident by the early 80s. Even though demand for energy remained inelastic in the short run, long run energy demand DLR is much more elastic because over a period of several years changes in energy use behavior can more readily occur.
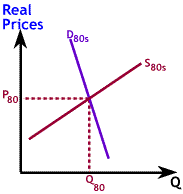
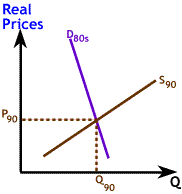
Much of the world's oil production is controlled by OPEC (Organization of Petroleum Exporting Countries). For a time these countries were able to successfully collude to keep supplies low and prices high (see the Current Event on Oil Prices). Since the mid 1980s, however, this cartel has been less successful at controlling the production of its members. Except for a few brief periods, the U.S. has enjoyed relatively low Real Prices for energy for most of the last decade. When oil prices first began dropping, consumption rose but it did so slowly since the short run demand curve is inelastic. When supplies of petroleum increased, illustrated by the shift from S80s to S90, real prices dropped significantly but consumption increased only slightly. We saw that habits established and purchases made prior to 1973 made the demand curve for oil inelastic in the early to mid 70s. This meant that large increases in prices led to small, initial reductions in demand. In the same way, choices made in the late 70s through the mid 80s made the demand curve inelastic in the late 80s so that falling prices for energy led to modest, initial increases in consumption. As prices continued to fall and as consumers became accustomed to cheap petroleum, and altered their choices accordingly, demand shifted out as we see below.
More than a decade of low and falling real energy prices produced a per capita energy usage in the U.S. almost as high as that prior to 1973. Heavier forms of transportation such as sport-utility vehicles, mini-vans and light pickup trucks became popular choices for U.S. drivers. Consumers' demand for high performance in all vehicles, from family sedans to pickup trucks, brought back the popularity of the V-8 engine as well as higher performance 6-cylinder engines. These choices reduced the average fuel efficiency of vehicles in the U.S., leading to increased energy usage as well as increased air pollution. New homes constructed in the U.S., customarily installed with central heating and air conditioning, enlarged in size as well as energy consumption from those built 20 years ago. The number and variety of electronic devices desired and used by U.S. consumers, in and out of their homes, expanded to include more TVs and VCRs, home computers, alarm systems, and cordless phones.
All of these changes, driven by years of cheaper oil and energy, shifted out the demand curve, shown as the shift from D80s to D98. In any period the short run demand curve for energy usage tends to be fairly inelastic. The long run demand curve, DLR, is much more elastic because consumers can and will make significant changes in energy usage patterns given sufficient time and price incentive to do so. In the long run, the driving force in energy consumption is almost exclusively price. U.S. consumers in 1998 are more conscious of environmental problems caused by air pollution than was true of their 1960s' counterparts, more aware of which devices and behaviors are energy wasteful, and yet low and falling prices led to consumption levels that are almost as high.
Energy usage patterns of U.S. consumers over the last quarter-century illustrate two important points in understanding any market. These are: demand is always more elastic in the long run than in the short run, and when it comes to explaining consumption of goods which are a significant part of the total cost of living, price matters above all else. Few goods remain more important to the quality of daily life for U.S. consumers than energy, especially in the form of fossil fuels, and there are no close substitutes. For these reasons the demand for oil, in particular, and energy, in general, is very inelastic in the short run. Nevertheless, given sufficient time to change consumption patterns, consumers reveal that they can and will alter consumption significantly in the face of large price changes. In explaining consumption patterns, apparently the price of oil overwhelms environmental concerns and worries about U.S. dependence on foreign oil sources.
Copyright © 1995-2003 OnLineTexts.com, Inc. - All Rights Reserved