
Copyright © 1995-2004 OnLineTexts.com, Inc. - All Rights Reserved

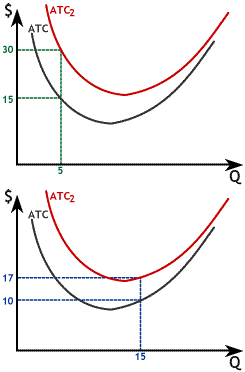
The graph to the right illustrates that an increase in Fixed Cost shifts ATC up and to the right. We also see that the effect on ATC is much greater when output is low.
When output is low, such as at 5 units, the increase in FC leads to a large increase in ATC. In this case ATC is twice as high on the higher curve. At higher levels of output, such as at 15 unitis of output AFC is smaller so the increase in ATC is also smaller.


Copyright © 1995-2004 OnLineTexts.com, Inc. - All Rights Reserved